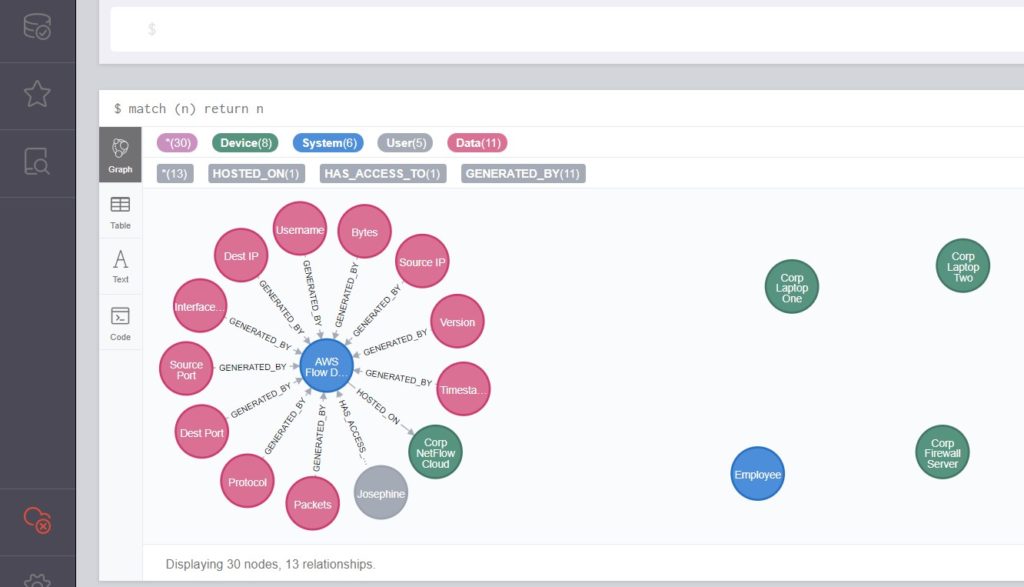
Visualizations are powerful. When talking about data relationships, graphs are of keen interest. This spring I spent 4 months building out an idea and writing a whitepaper that is now published on the SANS Reading Room.
The paper is called Defending with Graphs: Create a Graph Data Map to Visualize Pivot Paths.
How about a two sentence synopsis?
The tl;dr is that there are several well developed examples of attackers thinking in graphs (see John Lambert’s article) and room for more ideas for how to defend with graphs. I wanted to demonstrate a use case for security defenders building a graph data map representation of their environment and querying it to improve their ability to respond quickly and directly to an incident.

I hope you will peruse this work and find it useful. It builds on the work of several researchers, developers, and thought leaders including Chris Sanders’ pivotmap tool, Colin O’Brien’s grapl platform, and Olaf Hartong’s ATTACK datamap tool.


