• Skip to main content
  • Skip to footer

Brianne Fahey

  • Read My Blog
  • Contact Me

Data and Analysis

Defending with Graphs

July 21, 2019 by Brianne

Visualizations are powerful. When talking about data relationships, graphs are of keen interest. This spring I spent 4 months building out an idea and writing a whitepaper that is now published on the SANS Reading Room.

The paper is called Defending with Graphs: Create a Graph Data Map to Visualize Pivot Paths.

How about a two sentence synopsis?

The tl;dr is that there are several well developed examples of attackers thinking in graphs (see John Lambert’s article) and room for more ideas for how to defend with graphs. I wanted to demonstrate a use case for security defenders building a graph data map representation of their environment and querying it to improve their ability to respond quickly and directly to an incident.
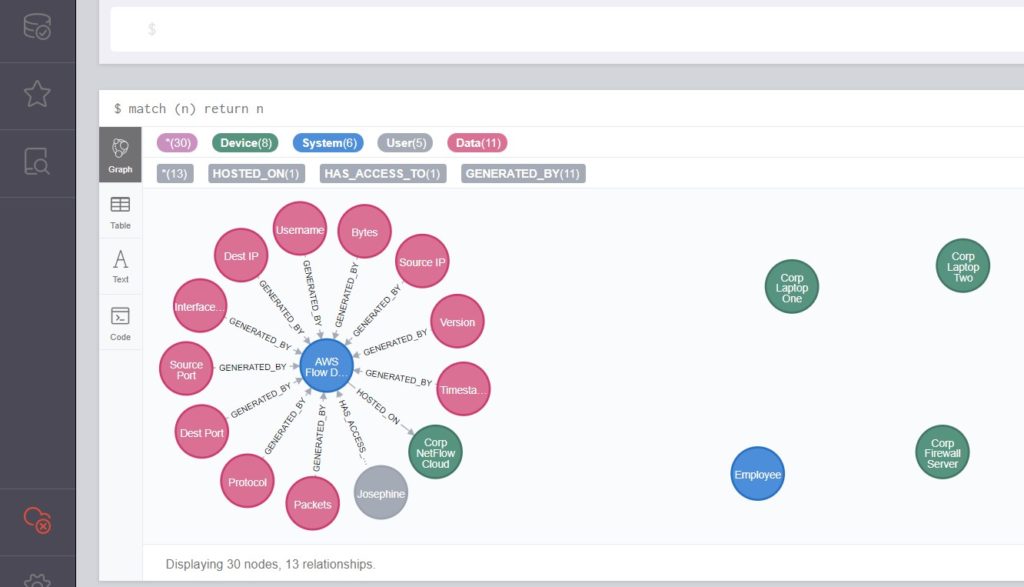
A look at an image from my results.

I hope you will peruse this work and find it useful. It builds on the work of several researchers, developers, and thought leaders including Chris Sanders’ pivotmap tool, Colin O’Brien’s grapl platform, and Olaf Hartong’s ATTACK datamap tool.

Filed Under: Data and Analysis, Featured, Technology Tagged With: chris sanders, colin obrien, diagram, graph database, olaf hartong, pivot, sans, visualize, writing

When a List Won’t Do

April 14, 2018 by Brianne

A Microsoft Technet article by John Lambert from 2 years ago includes this quote, and I’ve seen it used many times since then:

“Defenders think in lists. Attackers think in graphs.”

To me, this statement means that there are multiple possible paths available to get to an end if you can pivot and reorient while working through an environment. The environment may have been designed in a systematic hierarchy to maximize organization efficiency, but that doesn’t mean a wily actor can’t create their own circuitous route.

I mentioned in a previous post that I’ve been learning to dabble in Graph Databases. In fact, I am working to build a graph representation of the connections and pivots available in the logs and data typically available to an analyst in an investigation (inspired by one of my favorite parts of the Investigation Theory course).

Unlike a relational database, a graph database uses nodes, edges, and properties to build and describe relationships. Wikipedia describes the graph theory behind a graph database better than I can, but I put together the visualization below before my free trial of MindJet MindManager expired. If you can determine your nodes, labels, properties, and relationships – you can connect and visualize the net of assets and relationships in your scope. Let’s use the sample graph visualization of two colleagues names Bob and Cathy.

  • Nodes contain properties and are tagged with labels.
    • The person is a node, the property is their name and the labels are their position and their prestige.
  • Relationships connect nodes, have direction, and contain properties.
    • The relationships describe how the nodes (persons) are working and hiring.

I’ve been learning Neo4j to build a graph database.  Download this free Graph Databases ebook from O’Reilly to get started.  I’ve also watched some videos in an Intro to Neo4j course hosted by Lynda (which normally has a cost but can be accessed with my library card for free via the elearning offerings on my local library’s website). I’d also like to buy Learning Neo4j Graphs and Cypher book and video from Packt Publisher in the future.

In the starter use case I’m building out in my own Neo4j instance, the nodes are both data sources and data elements, and the relationships describe where the data elements are contained. The idea behind this is that if an analyst had one piece of data and wanted to get to another piece of data, they could explore the graph to see which nodes they have available to traverse in order to pivot the data from what you have to what you want.

For instance, if you have the IDS Alert available providing you a signature and protocol, but you need to know the details of the certificate used in the transaction, you can pivot fro the IDS alert through the PCAP and SSL Transaction to get to your destination.

I am still experimenting, I know my test data is imperfect.  Ideally, you could research the sources and elements available within your enterprise to create your Cypher code and output a visual database that allows you to look or query for a solution path. Somehow it feels much more impressive when you look at the connections for the data elements of a dozen or so different data sources at once.

This is a solid idea for a learning opportunity and a rough first implementation try. I’ll think on it some more and work to eventually hone something useful and repeatable that doesn’t take much effort to keep up to date. If you have any input, feel free to use the contact form on my website and reach out.

Filed Under: Applied Security, Data and Analysis, Knowledge Tagged With: analysis, applied network defense, cypher, graph database, lynda, microsoft, mindjet, neo4j, oreilly, packets, packt, pivot, project, visualize

I Think, Therefore I Am An Analyst

April 6, 2018 by Brianne

There are a lot of tools to learn in the cybersecurity trade. There are a lot of sources willing to teach you about those tools.  There are not many people interested in teaching you how to think like an analyst.

I just finished the 3rd course in my Chris Sanders’ Applied Network Defense trilogy: Investigation Theory. Before this course, I’d taken and reviewed Chris’ Effective Information Security Writing and Practical Packet Analysis.

Investigation Theory is a course designed to help an analyst develop a mindset to investigate any type of security event or alert. The course is built to take roughly 10 weeks and you can pace yourself to finish faster or slower.  Although it is offered fully online, Chris organizes the course so that a new group starts it together every few months.  The benefit of this is that no only do you have the ability to interact with the instructor Chris Sanders in the online course board, you also have the opportunity to post thoughts to and respond to questions from other students.  I definitely took something away from reading other students’ answers to Chris’s posted questions at the end of many lectures.

In addition to lectures, the course includes student community discussion, recommended reading, bonus lectures, and interactive investigation labs.

Nothing helps ideas stick better than hands-on practice.

The labs were challenging. I had to try most of them several times before I submitted the correct answer.  But I learned ideas of questions to ask and places to look for leads to those answers.

One of my favorite sections in the Investigation Theory course was built around explaining the value provided by different types of analysis data. It focused on the likely available sources in an investigation like packet captures, netflow data, IDS alerts, OSINT, and an armful of different log types. The lecture described the pros and cons of the source and highlighted opportunities to aggregate and pivot on data attributes provided.

I’m proud to have finished this course.  I would recommend it.  It is less technically specific than Practical Packet Analysis, but it is full of insights that will work for a security analyst no matter what tools and tactics you have experienced.

You can a course description, pricing, and registration information at the Applied Network Defense site.

Filed Under: Data and Analysis, Knowledge Tagged With: analysis, applied network defense, chris sanders, ids, lab, learn, netflow, networking, osint, packets, pivot, writing

Packet Analyzing

March 3, 2018 by Brianne

I recently finished Chris Sanders‘ Applied Network Defense online course for Practical Packet Analysis.  Before I give you my impressions of the course, let me give you an idea of where I’m coming from and what I expected.

I never captured a packet before mid-2017.

I knew I’d need some practice analyzing packets to maximize my experience in the SANS SEC503; Intrusion Detection in Depth course later this year. I’ve never had a job role that gave me the opportunity to work hands-on with networks so at times networking can be an Achilles heel of mine. I’ve done a lot of reading and a little bit of experimenting at home, so I was eager to pour myself into some labs and figure out what I could do and what I needed to work harder toward.

I purchased myself a course license and started chipping away at the materials in September.  I also bought a copy of Chris’s Practical Packet Analysis book through No Starch to use as a reference.

The Practical Packet Analysis course runs on demand (you can start as soon as you purchase a license) and includes more than 100 videos and more than 20 lab exercises. It’s available to you for 6 months.  I worked on it off and on a few hours a week for about 5 months and I noted a few lectures and labs I’d like to revisit in my last few weeks of access.  Because it was that good.

This course covers so much material.

It does a really incredible job of incrementally walking the student through progressively more specific and challenging material.  You start off with some high level network concepts and a lot of attention to the OSI Model, work into understanding how those protocols and activities manifest in real life, and then top it off with learning to efficiently comb through the packets captured from this network activity with tcpdump and Wireshark.

This course is worth every hour you put into it.

I will be able to use things I learned in this course immediately, even without needing to analyze packets daily in my day job. The lectures are well communicated. The material is current and specific.  Chris Sanders doesn’t lean on expensive tools or on only one way to approach a question.  He teaches you to think it through and answers questions by providing applicable advice instead of answers.  Certainly you can skim past sections you already know and visit subjects you’re struggling with more than once.  I particularly benefited from focusing on understanding the explanations for the malware labs analysis, examining HTTP responses, carving out transferred files, and exploring traffic manipulation.

I’m pleased to have finished the course and definitely open to taking any of the other Applied Network Defense Courses when I need to go deeper into the other available subjects.

Filed Under: Data and Analysis, Featured, Knowledge Tagged With: applied network defense, book, chris sanders, course, learn, networking, no starch, packets, review, wireshark

Typically Mean Averages

February 24, 2018 by Brianne

I wonder if I am a typical security analyst?

But what is typical?  Hard to tell what an average is since for every person near the core of the bell curve, there are quite a few outliers keeping things both challenged and balanced.  If asked to describe the typical security analyst, I would throw out a few generalizations based on what I’ve encountered in my experiences.

A profile performed by DataUsa.io has put together a slick Profile of the Average Security Analyst. The typical analyst experiences a solid salary, strong job growth, highly educated peers, demanding technical skill requirements, and a roughly 75% white 75% male field.

From https://datausa.io/profile/soc/151122/

Sounds awesome. And intimidating.

Everyone has their own reasons for moving to a Security Analyst role. I fit some of the general averages noted above, but not all. Certainly diversity of people bring diversity of thought.  If one of the main tenants of a secure enterprise is “Defense in Depth“, then certainly you should invest energy into building defense by diversity. Perhaps it is wise for both your layers of security and your team resources be deep, diverse, adept, and agile.

I don’t always love difficult people, but I do love challenging work.

I don’t see myself as a typical analyst because I bring differences in thought and approach.  I ask questions. I draw connections. I talk to people in the business. I look for ways to align things. I act with a goal in mind.  I draw it out or write it down and hone it till it works or throw it out and take another path toward the goal. I aim to evolve and improve. When I want to learn about someone I ask them out for a coffee walk or a breakfast.  I sometimes make songs out of the ideas I’m working through or take a doodling break to try to think into a breakthrough.

I do see myself as a typical analyst because I like to make order out of chaos. I want to understand what happened and enact protections. I often feel exhausted after a day with a lot of people interactions.  I easily memorize IP addresses and hostnames while I research events but I don’t always remember the names of my people I just met. I believe that Ex Machina and Black Mirror are equally awesome and terrifying because they’re tangibly realistic.

In this industry, the pace is fiery fast and the challenges are densely packed. The targets move and I’m sure the typical averages will also.

Filed Under: Data and Analysis, Featured Tagged With: analysis, career, datausa.io, defense in depth, diversity, industry

Footer

Social

  • GitHub
  • LinkedIn
  • RSS
  • Twitter

From the Blog:

Defending with Graphs

By Brianne

Make Your Way There

By Brianne

The Resourceful Will Find a Way

By Brianne

Research

Whitepaper in the SANS Reading Room:
Defending with Graphs: Create a Graph Data Map to Visualize Pivot Paths

© 2025 · P. Brianne Fahey, Cyber Threat Analyst